Bitcoin’s Net Unrealized Profit (NUP) ratio has fallen to levels historically associated with short-term market bottoms, potentially signaling that the recent correction may be nearing its end.
Bitcoin’s price decline over the past week has driven a critical on-chain metric to a zone that has, in multiple prior instances, preceded major recoveries. According to data from CryptoQuant, the Net Unrealized Profit (NUP) ratio has dropped to 0.476, marking its lowest reading since April and indicating a broad contraction in unrealized gains across the network.
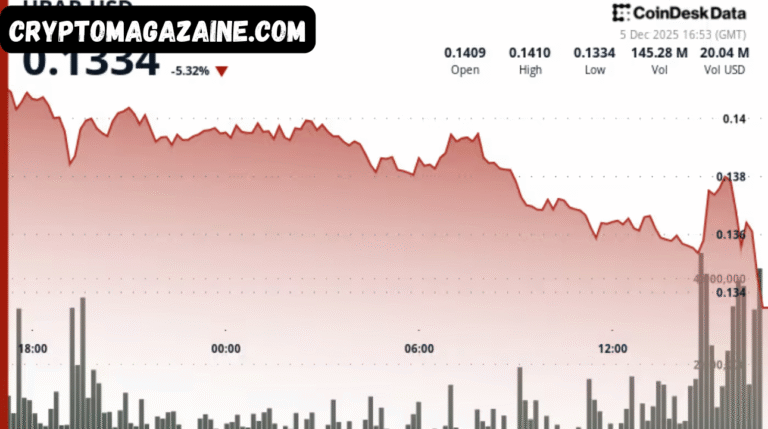
At the time of writing, Bitcoin (BTC) is trading around $103,000, down nearly 10% over the past seven days. Market analysts suggest that this sharp retracement — accompanied by reduced leverage and cooling derivatives activity — may be setting the stage for a short-term price bottom.
Understanding the NUP Ratio

The Net Unrealized Profit (NUP) ratio is a widely tracked on-chain indicator that measures the share of coins held in profit relative to the total Bitcoin supply. It is calculated by comparing each coin’s current market price to its last on-chain movement — effectively gauging how much of the market is “in the green” versus “underwater.”
- High NUP readings (above 0.6–0.7) typically occur when most holders are sitting on significant paper gains. These phases often precede profit-taking, increased selling pressure, and the formation of local or medium-term tops.
- Low NUP readings (below 0.5) indicate that a large portion of investors are near their cost basis or in unrealized loss territory, signaling capitulation and exhaustion among sellers.
The current reading of 0.476 puts Bitcoin squarely within the capitulation zone — a level that has previously aligned with turning points in market sentiment.
Historical Parallels Suggest Potential Reversal
Data from earlier in 2024 shows that similar dips in the NUP ratio to the 0.47–0.48 range preceded strong rebounds in Bitcoin’s price.
- In February 2024, when the NUP fell below 0.48, Bitcoin was trading around $42,000. Within weeks, it staged a sharp rally, climbing to $70,000 by mid-March.
- The same pattern repeated during the mid-year correction, with the NUP once again touching the lower bound before a renewed uptrend.
- Most recently, in October 2024, a reading of 0.47 coincided with a short-term bottom near $88,000, which was followed by a strong recovery that pushed prices to a new yearly high above $110,000.
In each case, these reversals were accompanied by a flush-out in leverage, declining funding rates, and reaccumulation by long-term holders — dynamics that appear to be repeating now.
Current Market Dynamics

This week’s drop in the NUP ratio comes amid heightened volatility across both crypto and traditional financial markets. The U.S. dollar index (DXY) has remained firm, while Treasury yields have stayed elevated, creating headwinds for risk assets, including cryptocurrencies.
Funding rates on perpetual futures have also cooled significantly, indicating that speculative longs have been largely washed out of the market. Meanwhile, spot exchange inflows have slowed, suggesting that forced selling pressure is easing.
According to analysts, these conditions create a fertile setup for a relief rebound, especially if global risk appetite improves and yields stabilize. In past cycles, rebounds from similar NUP levels have averaged 15–25% over the following month, depending on liquidity and macro sentiment.
Key Support and Resistance Levels
Technical analysts now view the $100,000–$102,000 region as a critical support zone, underpinned by high-volume trading activity and psychological round-number appeal. Below this level, the next notable support lies around $96,000, where major moving averages converge.
On the upside, resistance is expected near $108,000, followed by the $110,000–$112,000 range — levels that capped the October rally. If momentum returns and the NUP pattern repeats its historical behavior, a move toward these resistance zones could unfold in the coming weeks.
Investor Sentiment and Long-Term Context
While short-term traders remain cautious, long-term holders appear to be taking advantage of the weakness to accumulate. On-chain data shows a steady rise in coins held in “illiquid” wallets — a sign that conviction remains strong despite near-term turbulence.
Market strategist Benjamin Cowen commented that such NUP readings often represent “the intersection of fear and opportunity,” where weak hands capitulate and stronger hands re-enter the market.
“When NUP falls below 0.5, it’s historically been a buy zone,” he noted. “It doesn’t always mean the bottom is in, but it does mean that the worst of the selling pressure is often behind us.”
Conclusion Capitulation Before the Climb?
While no indicator guarantees future performance, the convergence of low NUP readings, declining leverage, and easing funding rates paints a picture reminiscent of prior local bottoms.
If the historical pattern continues, Bitcoin could soon find a floor around $100,000–$102,000, potentially setting the stage for a short-term relief rally into the end of the year.
That said, macroeconomic factors — including U.S. inflation trends, Federal Reserve policy, and global liquidity conditions — will likely determine the strength and sustainability of any rebound.
For now, the data suggests that capitulation may be giving way to accumulation, a familiar prelude to recovery in Bitcoin’s long-term cycle.
Read More: Alex Svanevik CEO of Nansen on Hyperliquid Blockchain Revenue and the Future of Crypto Loyalt