Hedera (HBAR) often moves differently from many traditional altcoins due to its enterprise-grade architecture, council-backed governance, and growing institutional interest. However, the latest market environment has placed significant downward pressure on HBAR, sending the token lower despite emerging speculation around new institutional products. In this comprehensive breakdown, we explore why Hedera drops alongside broader crypto market amid volume spike, what key technical indicators reveal, and how incoming ETF speculation may shape the token’s medium-term trajectory.
This long-form article examines price levels, support ranges, volume behavior, chart structure, and market psychology—all crucial components for understanding HBAR’s recent performance.
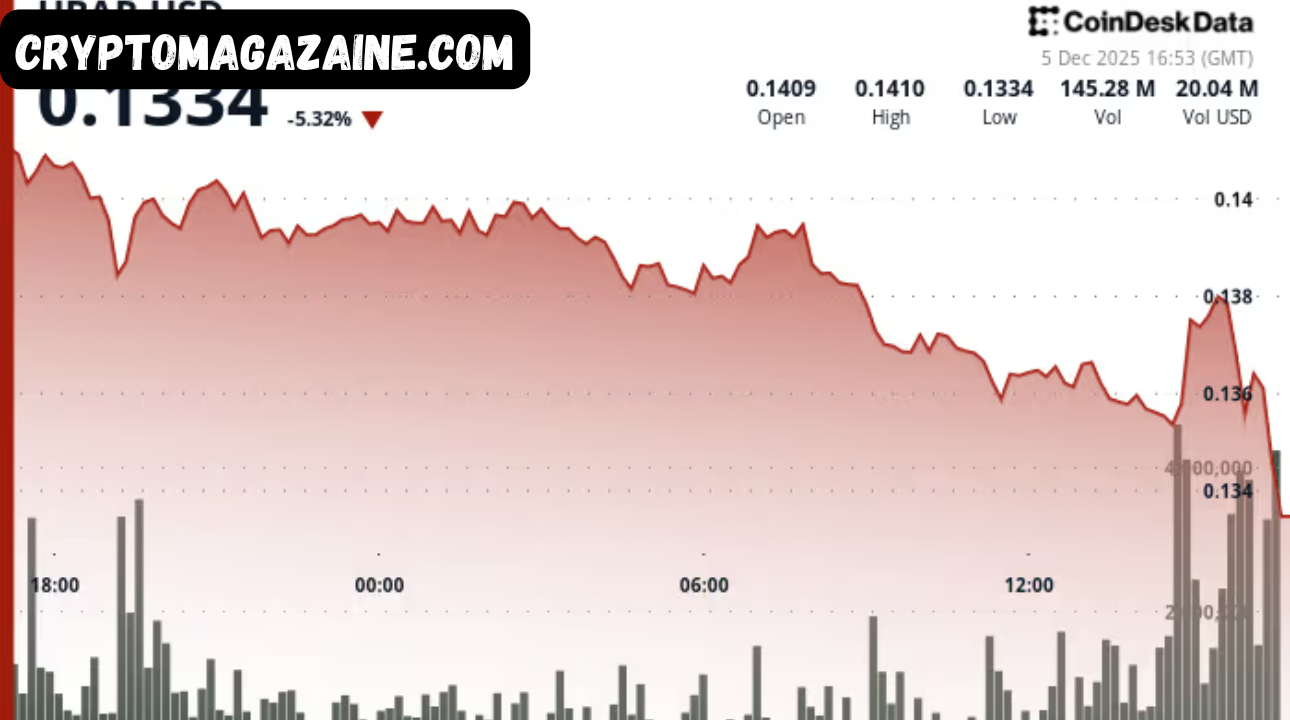
HBAR Price Declines Below Support as Broader Market Weakens
The crypto market faced widespread sell-offs, and Hedera was no exception. HBAR’s decline from $0.1391 to $0.1360 marked a clear break of the previously-respected $0.1380 support zone, signaling increased bearish activity.
This downturn occurred despite a wave of new ETF applications emerging for several altcoins, including HBAR, Litecoin (LTC), and Dogecoin (DOGE). These filings initially lifted sentiment across the market, but broader market volatility dragged prices lower across the board.
Even as long-term investors remained optimistic, the short-term trading landscape for HBAR turned distinctly bearish.
Volume Spike Confirms Breakdown Momentum
One of the most defining elements of this decline was the 47% surge in trading volume above the recent average. This type of volume pattern typically signals a strong conviction move, often aligning with the continuation of an existing trend.
Key volume highlights include:
- Breakdown volume reached 52.21 million, confirming that sellers dominated the session.
- The spike in volume validated the technical failure at the $0.1380–$0.1391 resistance cluster.
- Toward the end of the session, volume started to taper off, suggesting selling exhaustion was emerging.
- Hourly data showed intermittent gaps, which may indicate delays or inconsistencies in reporting from some market sources.
Volume remains one of the strongest indicators of trend strength, and in HBAR’s case, it reinforced bearish sentiment even as oversold signals began to appear.
Testing the Critical $0.1354 Support Zone
After falling through its primary support line, HBAR dipped to test the $0.1354 key support level. This price area has historically provided strong footing for recovery attempts, and this session was no different.
Key observations:
- HBAR briefly pierced below $0.1354 on a 2.37 million-volume dip, but quickly rebounded.
- Current trading levels hover around $0.1361, reflecting early defensive buying.
- This recovery does not yet mark a trend reversal; rather, it indicates the presence of short-term bargain hunters and algorithmic responses.
- Oversold conditions are showing on certain technical indicators—however, the downtrend remains firmly intact.
Traders now closely watch whether $0.1354 continues to hold, as a decisive break below it would open the next major bearish leg for HBAR.
Institutional Product Speculation Gives Fundamental Support
Despite the bearish technical behavior, fundamental developments suggest increasing long-term interest in HBAR.
New ETF applications reportedly circulating for HBAR, alongside LTC and DOGE, have triggered renewed optimism about institutional exposure. The involvement of Canary Capital Group in a proposed HBAR ETF could significantly influence the asset’s liquidity profile over time.
Why this matters:
- ETF products generally unlock new waves of structural demand, especially from institutional investors.
- They introduce ease of access for traditional market participants who may not use crypto exchanges.
- Even if approved months later, market anticipation often boosts long-term sentiment.
However, the contradiction between strengthening fundamentals and weakening short-term technicals is typical in early ETF speculation phases.
Technical Breakdown Key Levels for Traders
HBAR’s immediate outlook depends heavily on how it behaves around a few crucial price zones.
Support Levels
- Primary Support: $0.1354
- Held during session lows, remains the most important floor.
- Consolidation Support: $0.1357
- Current short-term defensive level.
- Supports intraday consolidation patterns.
Resistance Levels
- $0.1380 – $0.1391
- Former support now acting as resistance.
- Represents a heavy cluster of sellers.
- A break above this range would be an early bullish signal.
Risk Scenarios
- Bullish Case:
Recovery toward $0.1380 on oversold bounce potential if buying pressure increases. - Bearish Case:
Breakdown below $0.1354 could open the path to deeper retracement zones, likely toward $0.1330–$0.1340. - Neutral Case:
Sideways ranging between $0.1354 and $0.1380 as the market digests volume spikes and ETF speculation.
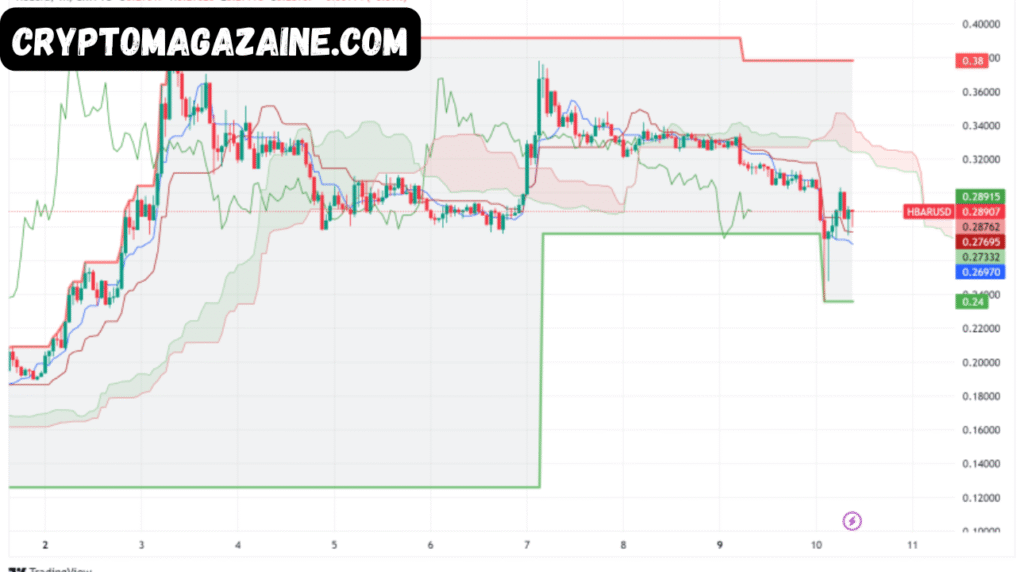
Chart Structures Highlight Bearish Trend Continuation
HBAR’s intraday and multi-hour chart patterns show several notable characteristics:
Successive Lower Highs
A classic sign of an established downtrend. Each bounce has been weaker than the previous one.
Range-Bound Movement
Price has been moving between $0.1354 and $0.1380 after the breakdown. This kind of range often develops before the next major directional move.
Oversold Bounce Probability
While bearish, HBAR is reaching levels where traders may attempt counter-trend plays for quick recovery moves.
Volume-Confirmed Decline
The alignment of heavy sell volume with downward momentum strengthens the overall bearish case.
Market Psychology and Trader Positioning
The market appears to be split between:
- Short-term traders reacting to oversold conditions and price compression.
- Long-term supporters encouraged by ETF applications and growing enterprise adoption.
- Momentum traders who continue to weigh the existing downtrend and volume-backed breakdown signals.
This divide produces the choppy behavior seen in recent sessions.
HBAR’s ability to hold above $0.1357–$0.1361 could attract risk-managed contrarian entries, but conviction remains low as technical patterns favor bears.
Long-Term View Remains Supported by Institutional Growth
Even though Hedera drops alongside broader crypto market amid volume spike, its broader long-term narrative remains intact:
- Hedera continues to expand its enterprise partnerships.
- More industries explore its hashgraph architecture due to performance and security advantages.
- Institutional interest, especially around ETFs, strengthens expectations for future price stability and growth.
While the short-term environment is bearish, HBAR’s fundamental foundation continues to evolve positively.
Conclusion HBAR Faces Short-Term Pressure but Holds Medium-Term Promise
HBAR’s recent price action reflects the push-pull dynamic between bearish technical trends and promising institutional developments. The breakdown below $0.1380 triggered heavy selling, but buyers defended the critical $0.1354 support area.
As long as the $0.1354 zone holds, HBAR maintains potential for a rebound toward the $0.1380 resistance.
A break below it, however, could accelerate downside movement.
For now, traders should monitor:
- Support at $0.1354
- Volume patterns during consolidation
- Strength of ETF-related sentiment
- Continuation of broader market volatility
HBAR’s near-term phase remains cautious, but its long-term trajectory stays supported by growing institutional and enterprise confidence.