Bitcoin Tests Critical
Bitcoin Tests Critical Support Levels Below $100K
Bitcoin briefly dipped below the $100,000 threshold on Tuesday, marking its first trip under six figures since June. The largest cryptocurrency by market capitalization fell to intraday lows of $98,951, before rebounding slightly to trade around $102,709 at press time.
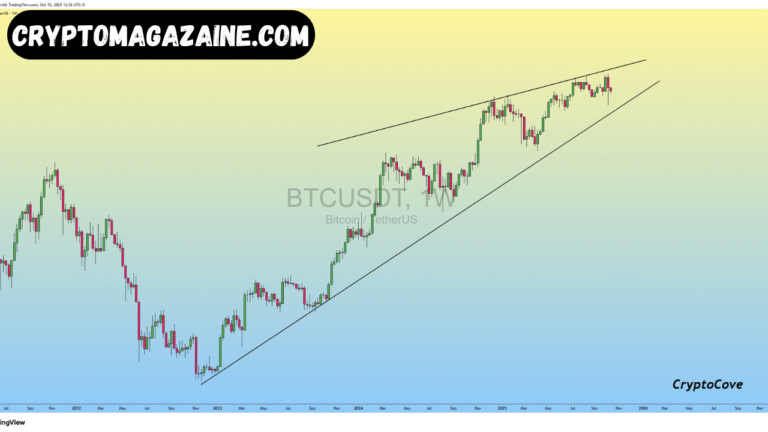
The drop brought BTC dangerously close to two technical levels that have served as the backbone of this cycle’s bull market — the 365-day simple moving average (SMA) at $102,055 and the 365-day exponential moving average (EMA) at $99,924. Both have acted as dynamic support lines since early 2024, cushioning repeated drawdowns and providing springboards for fresh rallies.
According to on-chain data from Glassnode, Bitcoin has now tested these long-term trend indicators for the third time since late 2023 each instance leading to short-term corrections ranging between 10% and 25%.
The Pattern Three Profit-Taking Phases in 24 Months

A familiar pattern appears to be repeating. Since December 2023, Bitcoin’s bull market has been punctuated by three major corrections, each corresponding to profit-taking activity by long-term holders (LTHs) investors who have held their coins for at least 155 days.
The first wave occurred in March 2024, shortly after Bitcoin broke above its previous cycle high near $69,000, pushing into the $75,000–$80,000 range. A second wave came during the “tariff tantrum” of April 2025, when geopolitical and trade tensions triggered a broader sell-off across risk assets, briefly dragging BTC to $76,500.
Now, in November 2025, the third wave has arrived. The current decline has been amplified by a reduction in LTH supply — from a record 14.7 million BTC in July to 14.4 million BTC today. While that may appear modest, the 300,000 BTC moved represents roughly $30 billion at current prices.
Long-Term Holders Take Profits
The LTH Supply metric, compiled by Glassnode, measures the total amount of Bitcoin held by wallets unmoved for at least 155 days effectively separating “strong hands” from more speculative traders.
In previous cycles, long-term holders have tended to distribute coins into market strength, helping form cycle tops. However, in 2025, their selling has been more controlled a sign that the market may be entering a mid-cycle reaccumulation phase rather than a final blow-off top.
“What we’re seeing now is strategic profit-taking, not panic selling,” said James Check, lead analyst at Glassnode. “Long-term holders are trimming exposure near historical resistance levels, while still maintaining conviction in the broader bull structure.”
This gradual release of supply has provided liquidity to newer entrants, preventing overheated price action while simultaneously capping upside momentum.
Moving Averages Define Market Structure
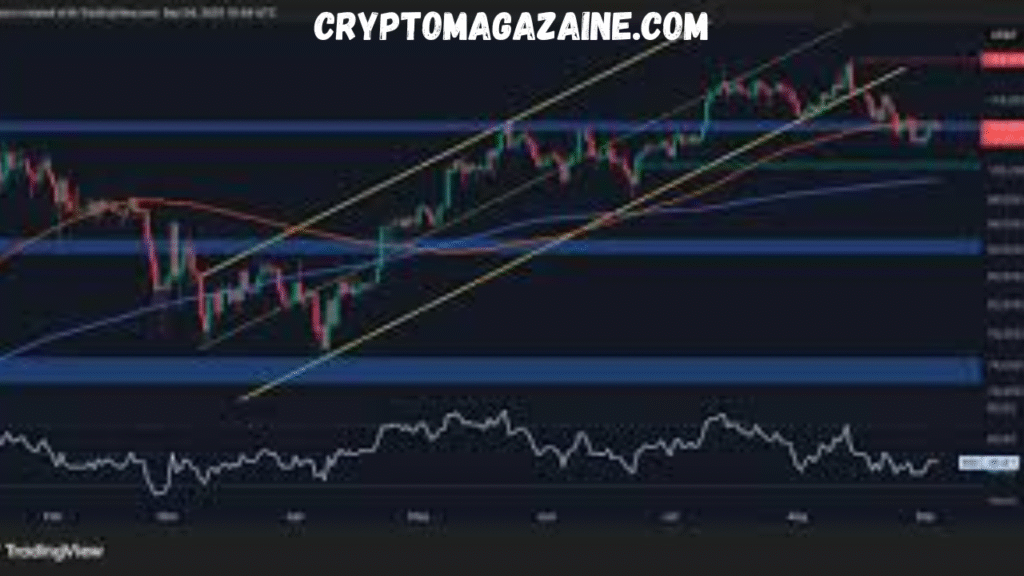
The 365-day SMA and EMA have emerged as key structural levels throughout this cycle. The SMA, which gives equal weight to each day’s closing price, reflects the market’s average long-term value zone. The EMA, which emphasizes recent data, reacts faster to trend changes and serves as a more responsive support line.
During the August 2024 consolidation, Bitcoin’s price briefly undercut the EMA at $48,963, before bouncing back sharply as buyers stepped in near the SMA. This interaction repeated in April 2025, when both averages were broken temporarily, only for BTC to reclaim them within weeks.
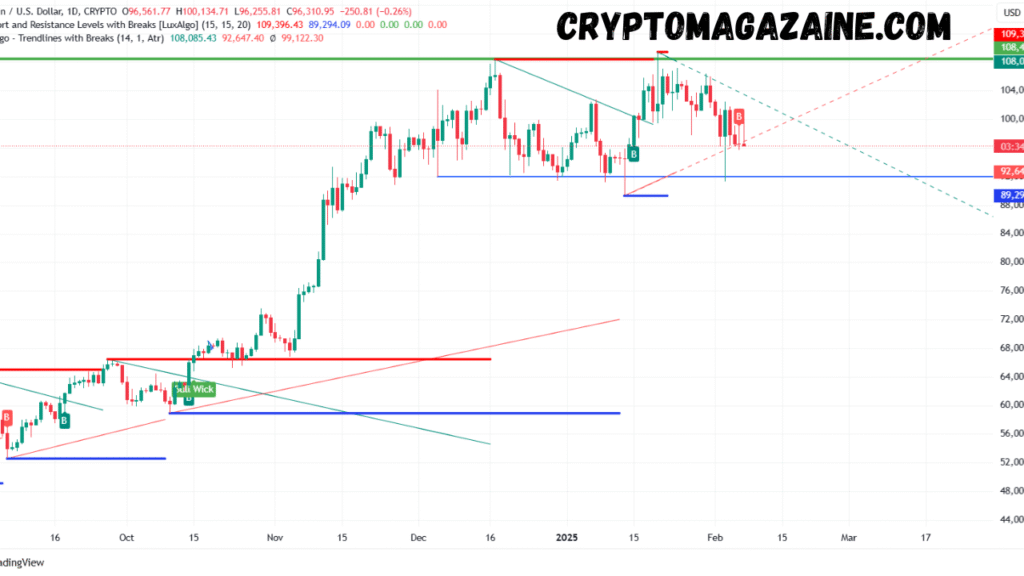
Technicians now view the two averages as the “heartbeat” of the ongoing bull market. A sustained close below both, however, could indicate a deeper retracement phase potentially toward the $90,000–$92,000 zone, where stronger on-chain accumulation occurred earlier this year.
Macro Factors Add to Uncertainty
Beyond technical indicators, several macroeconomic variables have added complexity to Bitcoin’s current trajectory. Rising global interest rates, persistent inflation concerns, and a cooling AI-driven equity rally have redirected some capital flows away from digital assets.
Additionally, the U.S. presidential transition period with markets still digesting President Trump’s renewed trade stance and proposed tariff expansions has injected volatility across commodities and currencies. Historically, such periods of fiscal and monetary uncertainty have led to heightened correlations between Bitcoin and traditional risk assets.
Nevertheless, analysts emphasize that Bitcoin’s macro resilience remains intact compared to prior cycles.
“Even with these corrections, Bitcoin is consolidating above the 2021 highs,” noted Katie Stockton, founder of Fairlead Strategies. “That’s structurally bullish. The long-term uptrend is still well-supported as long as the 365-day averages hold.”
On-Chain Sentiment Holding Not Hiding
Glassnode’s data suggests that while some long-term holders have been distributing, short-term holders (STHs) those who acquired coins within the past five months have been absorbing supply without panic. Exchange inflows remain moderate, implying that most selling occurs over-the-counter or through derivative hedging rather than spot liquidations.
Moreover, the realized price of LTHs the average cost basis of coins held long term currently sits near $70,000, suggesting ample profit margins remain intact. Historically, major bear markets have only emerged when spot prices fall below this realized threshold.
This on-chain dynamic indicates that while the market is cooling, it’s far from capitulating.
Lessons from the Past 2023–2025 Cycle Echoes 2017–2021
Market historians have drawn comparisons between the 2023–2025 bull cycle and the 2017–2021 pattern. Both cycles featured repeated tests of long-term moving averages amid strong macro narratives — institutional adoption then, digital asset tokenization and AI integration now.
The 2017 bull run saw three significant 30% corrections before peaking at $20,000. Likewise, the 2021 cycle had four corrections averaging 25% each before its all-time high of $69,000. The current cycle’s three retracements fit within that historical rhythm, underscoring Bitcoin’s tendency to “breathe” within longer upward trends.
What Comes Next Eyes on the 365-Day Averages
As the market digests recent volatility, analysts remain divided on whether the current correction marks the start of a larger retracement or just another healthy reset.
If Bitcoin closes several weeks below both the 365-day SMA and EMA, technical models suggest potential downside toward $90,000–$92,000, aligning with the 2025 year-to-date value area. However, a sustained recovery above $105,000 could quickly reassert bullish momentum, targeting the $120,000–$130,000 range.
Derivatives markets show mixed sentiment: perpetual futures funding rates have normalized after months of overheating, while open interest remains historically elevated, signaling ongoing speculative participation.
The Bottom Line Controlled Cooldown Not Collapse
The current correction phase illustrates Bitcoin’s maturing market structure. Long-term holders are realizing profits, yet doing so in a measured manner; technical support zones remain intact; and macro volatility, while present, hasn’t broken the broader bullish narrative.
In essence, Bitcoin appears to be resetting within its bull market, not exiting it. As long as the 365-day moving averages act as a foundation, the cycle’s broader uptrend remains unbroken.
“Every correction in a bull market feels like the end,” said analyst Will Clemente of Reflexivity Research. “But more often than not, it’s just the market catching its breath before the next leg higher.”
At press time
- Bitcoin (BTC): $102,709.59
- 365-day SMA: $102,055
- 365-day EMA: $99,924
- LTH Supply: 14.4 million BTC
- Total BTC Market Cap: $2.02 trillion
Data Source: Glassnode, Coin Metrics, TradingView. This article is for informational purposes and does not constitute investment advice.
Read More: Bitcoin Bounces Near $100K as $1.6B in Long Liquidations Shake the Crypto Market